Dynamical Masses Across the Hertzsprung-Russell Diagram
"Have you ever wondered why some stars appear bluer while others are redder? Or why some stars shine brightly while others remain faint?"
In order to answer this question, early twentieth century astronomers Ejnar Hertzsprung and Henry Norris Russell introduced the Hertzsprung-Russell (H-R) diagram, a fundamental tool that plots the relationship between a star's temperature and its luminosity, or brightness. By plotting a star on the H-R diagram, astronomers can infer its size, temperature, and stage of life.
However, such measurements were imperfect: "robust mass measurements in astronomy remained a challenge, hindering our ability to validate our understanding of stellar physics using observational data."
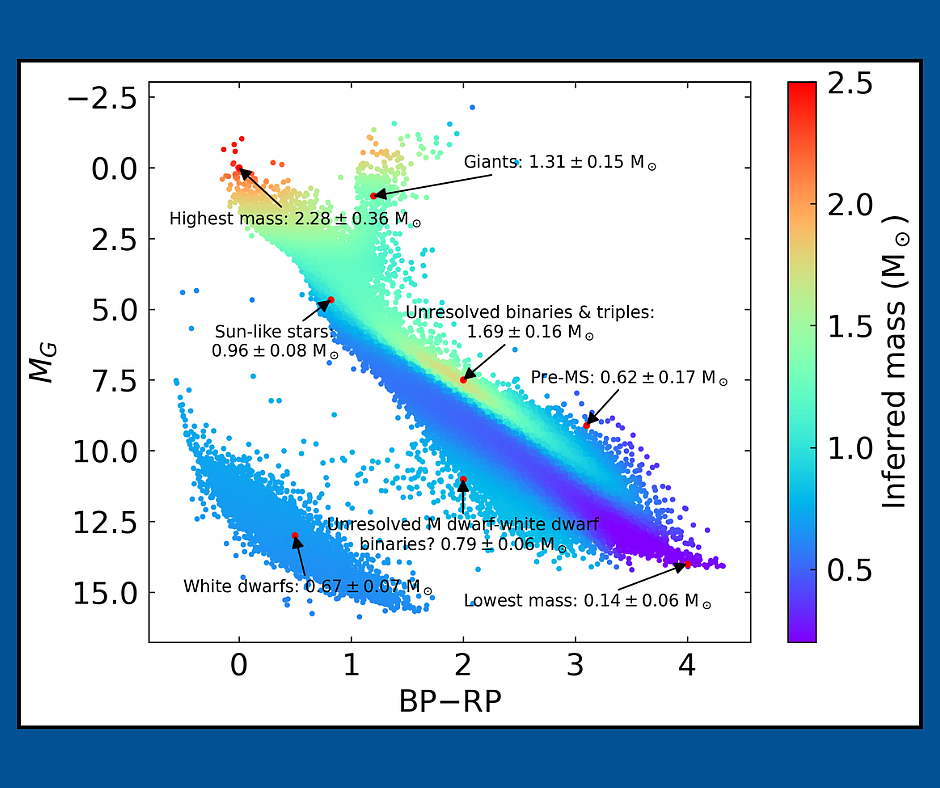
In a paper published earlier this year, Hsiang-Chih Hwang, Member in the School of Natural Sciences, plotted the measurement of stellar masses across the entire H-R diagram using the latest data from the Gaia space telescope. The paper represents "a milestone for astronomers to confidently measure star masses in relation to their colour and brightness. It marks an important step to answer ancient questions about stars, and advancing our knowledge of stellar physics and the Milky Way."
A key diagram from their paper, shown below, was chosen as Gaia's Image of the Week.